4175 Views
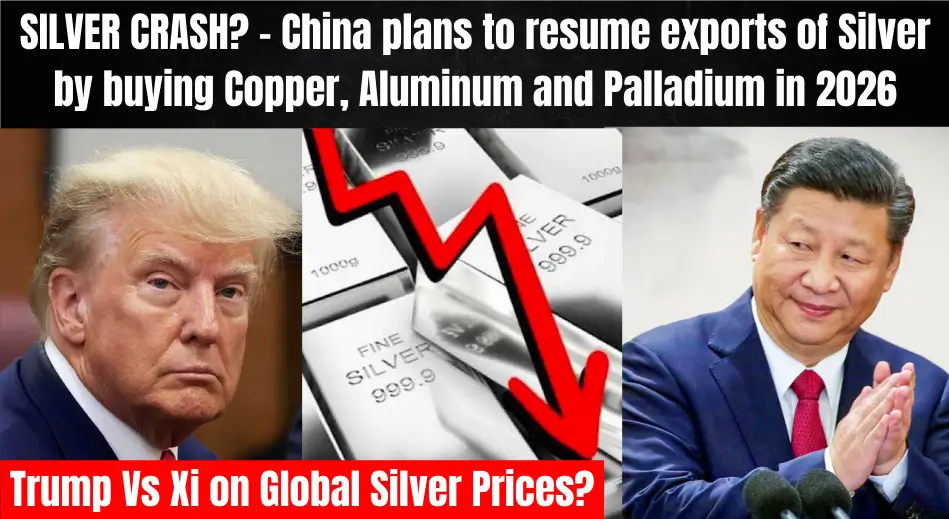
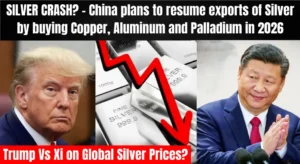
SILVER CRASH? – China plans to resume exports of Silver by buying Copper, Aluminum and Palladium in 2026
Huge Silver price Crash in 2026?, US and China discovered Dozens of Silver mining in South America, China to resume Silver Exports by midyear of 2026.

Recently, it has been reported that China is about to start exporting Silver globally again, due to which Silver prices have seen an outflow of around $800 billion worth from the Silver Market Cap within the last 24 hours, and investors believe that Silver will face a major crash in 2026. The top silver holders worldwide vary depending on the category: reserves (economically mineable resources in the ground), above-ground holdings (physical bullion in vaults, ETFs, institutions, or private investors), production (annual mining output), or investment demand (retail/coin/bar purchases by country). Silver differs from gold because central banks hold very little as official reserves (unlike gold). Most large holdings are in private/institutional hands, mining companies, exchanges, or ETFs. Data is from sources like the U.S. Geological Survey, The Silver Institute’s World Silver Survey 2025, and market reports (as of recent 2025 figures).
1. Largest Silver Reserves by Country (Known Mineable Resources)These represent potential future supply, not current physical holdings. Global total: ~640,000 metric tons (approx.).
- Peru: ~140,000 metric tons (largest holder, ~22% of world total)
- Australia: ~94,000 metric tons
- Russia: ~92,000 metric tons
- China: ~70,000–72,000 metric tons
- Poland: ~61,000–63,000 metric tons
Other notables include Mexico (~37,000 MT), Chile, Argentina, the US, and Bolivia.2. Largest Physical Silver Holders (Bullion/Vaults/Institutions)These are among the biggest known above-ground stacks (in millions of ounces; note figures fluctuate and some are estimates):
- iShares Silver Trust (SLV ETF) — Custodied by JPMorgan; historically one of the largest single holders (hundreds of millions of ounces; e.g., past peaks over 338 million oz, with ongoing inflows/outflows in 2025–2026).
- JPMorgan (COMEX vaults) — Holds a significant portion of registered/deliverable silver on the COMEX exchange (often speculated as ~50% of COMEX at times; one of the top institutional stacks).
- Other ETFs and trusts (e.g., Sprott Physical Silver Trust/PSLV, with major inflows and capacity expansions to billions in potential buying power in 2026).
- Texas Precious Metals Depository and similar large private/institutional vaults (holding 100+ million ounces for clients).
Central banks hold minimal silver officially (some reports note small positions or indirect exposure by Russia, India, and Saudi Arabia via ETFs or purchases, but not on gold’s scale).3. Top Countries by Physical Silver Investment Demand(Primarily retail bars, coins, and private holdings; historical decade-long trends show concentration in a few nations.)
- United States — Often the largest investor in physical silver bullion/coins (e.g., leading cumulative purchases over recent decades).
- India — Very strong demand, sometimes surpassing the US in certain years (cultural/jewelry/investment use).
- Germany — Significant retail bar/coin buying.
- Other notables: China, Canada, Australia.
These four (US, India, Germany, Australia) have dominated physical investment markets in recent analyses.4. Other Context: Top Producers (Not Holders, but Related to Supply)For reference, the biggest mining output (2024 data) comes from:
- Mexico (top producer)
- China
- Peru
- Bolivia/Poland/Chile/Russia/US
Top countries, including China, Peru, Bolivia, Chile, and Mexico, report large-scale silver mining or Natural Resources in Latin America. Approximately 1.74 million metric tons of silver have been mined throughout human history.
Top Silver-Producing Countries (2024 Mine Production)
- Mexico — 6,300 metric tons (~24–25% of global total)
Dominates with major operations like Peñasquito, Fresnillo, and Juanicipio. It has held the #1 spot for over a decade. - China — 3,300 metric tons (~13%)
Mostly byproducts from base metal and gold mining, significant domestic refining, and industrial use. - Peru — 3,100 metric tons (~12–13%)
Key mines in the Andes; it also holds the world’s largest known silver reserves. - Bolivia — 1,300 metric tons
Growing output, often from polymetallic deposits. - Poland — 1,300 metric tons
Primarily from KGHM’s copper-silver operations in Europe. - Chile — 1,200 metric tons
Byproduct from large copper mines. - Russia — 1,200 metric tons
From various polymetallic and gold-related sources. - United States — 1,100 metric tons
Mainly from mines in Alaska, Nevada, and Idaho (e.g., Rochester, Greens Creek).
Other notable producers include Australia (~1,000 MT), Argentina, Kazakhstan, and India, but they fall outside the top tier. The top 3 countries (Mexico, China, Peru) account for over half of global production, while the top 10 cover most of the supply. Currently, Argentina just discovered a large 1,600+ Metric Tons of Silver mining amid rising global demand and China’s ban on silver exports. Trump and BlackRock are keeping an eye on the world’s Second largest Silver Mining in Latin America as China is buying Silver from Mexico, Peru, and Chile.
China plans to approve Russia’s mRNA Cancer Vaccine to halt $100 Billion worth of American Pharma imports
Top 5 countries agreed to pay $2 Million in Chinese Currency to Iran for Passes through the Strait of Hormuz
Gulf States have suffered losses of $20 billion in oil and gas revenue since start of the US-Iran War or blockade of Strait of Hormuz

Iranian IRGC pauses strikes against UAE, Qatar, Bahrain, and Saudi Arabia after complete destruction of US bases

Israel’s War against Iran could destroy its GDP, banks, oil fields, interests, and the regime of Netanyahu

Thomas Massie demands the immediate seizure of Epstein-Linked Companies and Businesses in the US

Epstein Files are dragging Bitcoin into Political conflict without evidence that Bitcoin was made by Epstein or MIT

The Russian army is fighting the European Rothschild, not Ukraine, NATO, or US, World War III is exposed in the Epstein Files
SILVER CRASH? – China plans to resume exports of Silver by buying Copper, Aluminum and Palladium in 2026

France army is preparing to seize Russian oil tankers in the Mediterranean Sea and Bay of Biscay
China plans to approve Russia’s mRNA Cancer Vaccine to halt $100 Billion worth of American Pharma imports
Top 5 countries agreed to pay $2 Million in Chinese Currency to Iran for Passes through the Strait of Hormuz
China’s exports reaches a record high $1 trillion despite the Trade war with US, Europe failed to defeat China

NATO nations betrayed Israel and the US for Russia’s new shipping and Economy corridor lanes in 2026

NVIDIA fears the loss of $1 trillion due to Foreign FDI moving into Huawei and OpenAI’s stakes

Mamdani will impose up to 5% taxes on $5 trillion wealthiest Pro-Israeli Jewish companies
Trump Tariff has earned $6 trillion in ‘withholding taxes’ in 2025, during the Tariff war against China, India, EU and Canada
African nations uniting against the US, UAE, NATO and Israel to protect Africa’s $25 trillion worth of Natural Resources